SHOPIFY ANALYTICS & GA4 SETUPAnalytics
Measurement you can trust and models that forecast what growth looks like — so every decision has numbers behind it.
(What’s included)
Everything in
this chapter
Take the whole chapter, or just the parts you need.
- 01
Dashboard creation
One view of sales, marketing and customer health.
- 02
GA4 / GTM configuration
Tracking set up properly — and maintained.
- 03
Customer LTV modeling
Which customers are worth the most, and why.
- 04
Customer surveys
Hearing directly from buyers and browsers.
- 05
Customer data appends
Richer customer profiles for better targeting.
- 06
Revenue growth modeling
Forecasts that show what growth will take.
(How it works)
How we deliver
- STEP 01
Audit tracking
Find gaps and errors in current data.
- STEP 02
Fix & configure
GA4, GTM and events set up right.
- STEP 03
Build dashboards
The numbers your team needs, in one place.
- STEP 04
Model
LTV, cohorts and revenue forecasts.
- STEP 05
Review monthly
Insights turned into actions.
(Platforms & tools)
What we
work with
- GA4
- Google Tag Manager
- Looker Studio
- Shopify Analytics
- BigQuery
- Power BI
- Google Sheets / Excel models
(What you get)
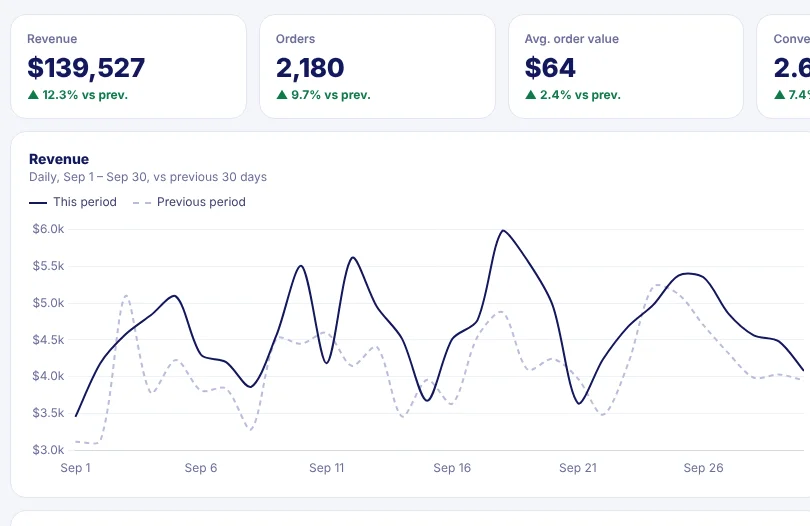 Sample deliverable · Commerce dashboardStore performance dashboard
Shopify, GA4, ads and email in one view — revenue, funnel, channels and products.
Explore the sample dashboard
(FAQ)
Good
questions
Usually, yes — mismatches come from tracking gaps we can find and correct.
We can maintain them on a retainer or train your team.
Read-only access to analytics and store data is enough to start.